Show Details of Model Elements in Tabular Form
When the default attributes do not suffice to describe your model elements, you can add your own custom ones by using tagged values. These custom attributes can be added to model elements in various diagrams, such as an actor in use case diagram.
So if you are looking at model elements in a diagram, just how do you show their tagged values? This tutorial will show you how.
As an example, we will walk you through how to show tagged values associated with devices in an ArchiMate diagram.
What we are using in the examples
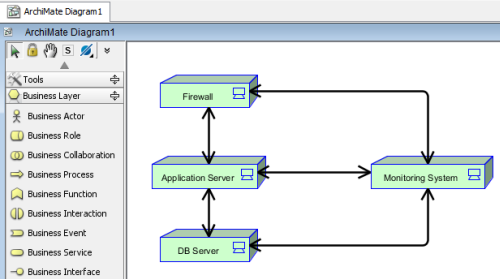
The below examples are all referring to the sample ArchiMate diagram below, which is composed of several devices (i.e. Firewall, Application Server). The software tool is called Visual Paradigm for UML (VP-UML).
Download the sample project file
Example 1: View tagged values of a model element
Let’s say we want to look at the tagged values for the device called Firewall in the diagram.
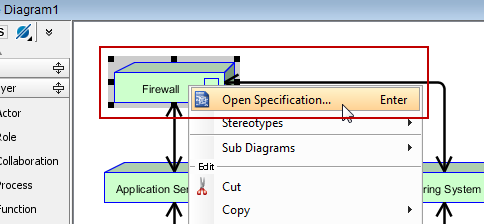
- Right click on Firewall and select Open Specification…
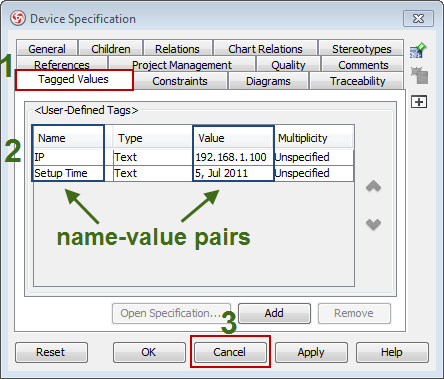
- In the dialog box opened, select the Tagged Values tab.
Under it, you will see a tag called IP (value = 192.168.1.100) and another one called Setup Time (value= 5, July 2011).
Since we were viewing only (without any changes), click Cancel to close the dialog box.
Example 2: View tagged values of multiple model elements without repeatedly opening the dialog box
Let’s say we are now interested in viewing tagged values for all devices in the diagram. So based on what we’ve just seen above, does it mean we must right click on every single device and repeatedly open and close the dialog box?
Well, that’s one way. Here’s a better way:
- To begin, (just like before) right click on any of the devices and select Open Specification…
- Open the Tagged Values tab and you’ll see the tagged values of the device currently being selected.
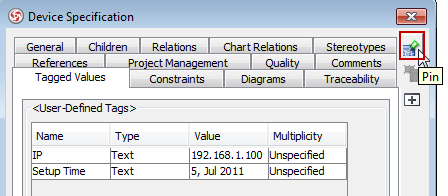
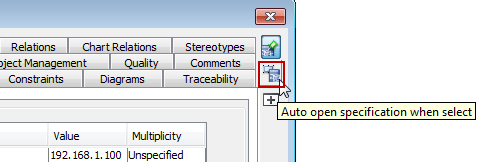
- (Different steps) Do not click Cancel to close the dialog box yet. Instead, go to the upper right corner to click the Pin button.
- Once you’ve clicked the Pin button, the button below it (with the tooltip saying “Auto open specification when select“) should be enabled. Click on it.
- Select another device (i.e. Application Server) and you’ll see that the tagged values in the dialog box are updated to Application Server’s. The dialog box continues to show tagged values of the model element currently being selected.
Example 3: View tagged values of model elements in tabular form
To view all tagged values across model elements in the same diagram, we will next create a grid and then populate it with those tagged values.
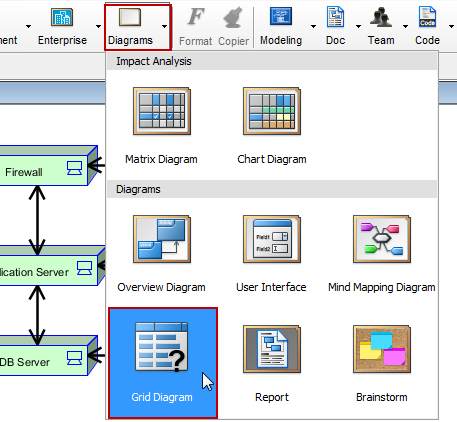
- From the main toolbar, select Diagrams > Grid Diagram.
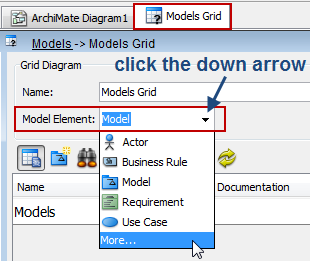
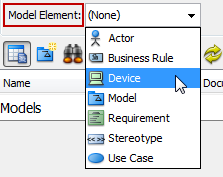
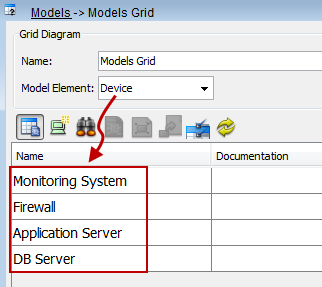
- In the new Grid, click the down arrow next to Model Element to select Device. (Note: if Device is not listed initially, click More… at the bottom of the list and Device should show up then.)
Select Device.
The grid is now populated with all devices from the diagram.
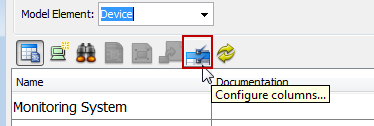
- Click Configure columns…
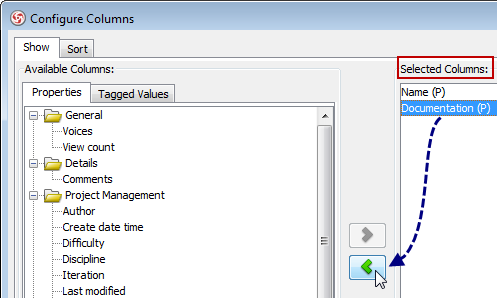
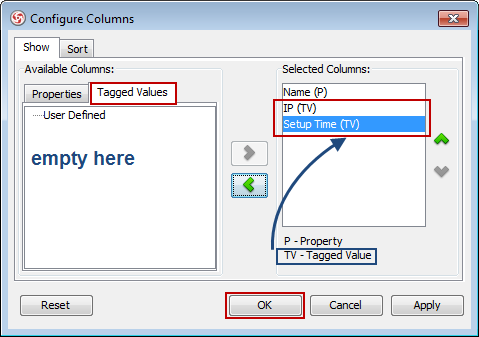
- In the dialog box opened, you will see the two default columns given initially – Name and Documentation.
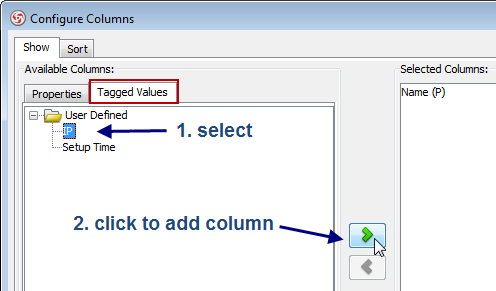
As we don’t need the Documentation column, select it and click the left green arrow for removal. - In the dialog box, click the Tagged Values tab. Select IP and then click the right green arrow to insert that column.
- Repeat similar steps above to add the Setup Time column. The dialog box should look something like this after you are done. Click OK.
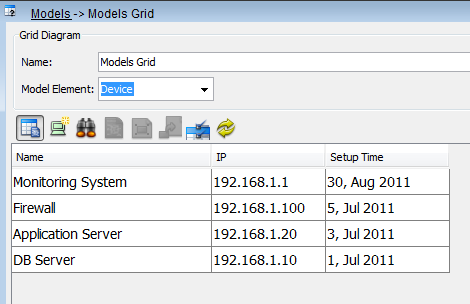
- Upon closing the dialog box above, the grid will display the tagged values for all devices in the diagram.
Related Links
- Watch this tutorial in YouTube
- YouTube Video – ArchiMate for Modeling Enterprise Architecture
- How to create a ArchiMate diagram
- More on what Grid diagrams can do for you
Related Articles



Leave a Reply
Want to join the discussion?Feel free to contribute!