

Debug your plugins with IntelliJ IDEA
 Visual Paradigm Open API provides an interface for developers to develop plugins and extend the functionalities of Visual Paradigm. During development of the plugin constant modifications will be done to fine tune your plugin. Instead of deploy the plugin to VP every time after you made changes, you can directly launch VP with your plugin from IntelliJ IDEA to perform debugging. This article teaches how to configure IntelliJ IDEA to perform debugging on your plugins.
To configure IntelliJ IDEA to debug your plugin:
- Add the following jar files (under Visual Paradigm’s installation directory) to your IntelliJ IDEA project as the External Libraries.
Jar file {VP Installation dir}/lib/jniwrap.jar {VP Installation dir}/lib/lib01.jar – lib09.jar {VP Installation dir}/lib/openapi.jar {VP Installation dir}/lib/vpplatform.jar {VP Installation dir}/ormlib/orm.jar - Go to Run > Edit Configurations.
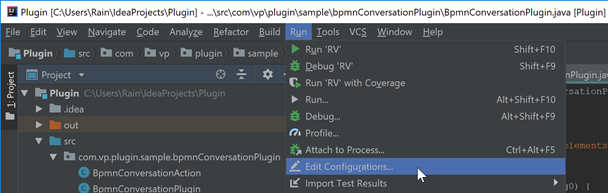
Edit Configurations
- Select Application under Templates.
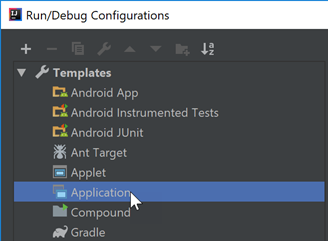
Select Application under Template
- Specify the following parameters in configuration.
Properties Value Main class RV VM options -Xms256m -Xmx768m Program arguments debug Working directory {bin folder of your VP application} Use classpath of module {select your plugin project} 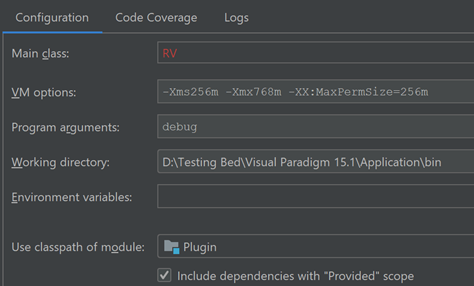
Debug configuration
- Press OK to save the change.
- Expend the jar in External Libraries and locate the class RV.
- Right click on RV class and select Debug ‘RV.main()’ from popup menu.
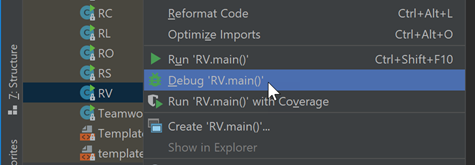
Launch Visual Paradigm form IntelliJ IDEA
After that Visual Paradigm will be started. You can execute your plugin and with the debug information print to the Console window of IntelliJ IDEA. You can also modify your plugin source code and rebuild your project to patch the class to Visual Paradigm’s runtime without relaunch the software.
Related Know-how |
Related Link |
Leave a Reply
Want to join the discussion?Feel free to contribute!