

Permission Error on Perform Software Update (UP0001)
When perform software update you may receive error complain didn’t have sufficient permission to perform software update.
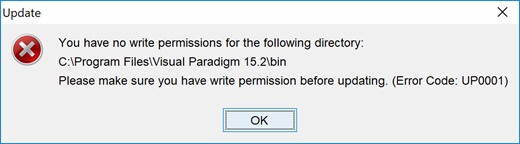
No permission to perform software update
When perform software update you may receive error complain didn’t have sufficient permission to perform software update.
No permission to perform software update
Fill-in Doc in Visual Paradigm’s Doc. Composer is a powerful tool which allow Visual Paradigm inject diagram and model information into your Microsoft Word document. In your Word document you only need to define the Doc. Fields (special tags) for data injection. When the Doc. Composer engine go through your document it will replace the tag with appropriate diagram and model data according to the template (customizable) you specified. Read more
When working with a large scale project with numerous diagrams, there may be some performance difference. It is only natural as huge projects impose more demanding resource allocation. Fortunately, Visual Paradigm offers ways to gear up for better accommodation. Basically, there are 3 practices we would recommend:
For details, please visit Performance tune up for your large project.
On the note of resource allocation, some tasks are more memory-intensive than others, such as document generation which needs to process most of the elements (if not all) within your project. The default memory size is set for popular computer configurations but can be increased to speed up the process when needed.
Doc. Composer allow user retrieve and output model details by creating custom templates. In this article we will create custom template to output all use case diagrams and its containing use cases into document.
Layout of diagram is a resource intensive action. By default Visual Paradigm set the limit to handle maximum 300 connectors in single diagram when perform layout. If your diagram got more than 300 connectors then the following message will be shown when you try to perform layout.
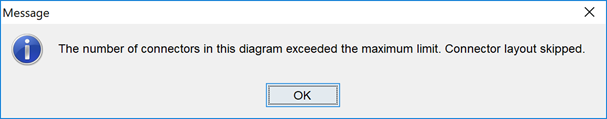
Layout diagram hitting maximum number of connector limit
With the Doc. Composer user can output the details of the sequence diagram into HTML, PDF and MS Word. In this article we will create customized template to output the call message of a lifeline including the call message operation signature to document.
PostMania is a tool bundled in VP Teamwork Server/VP Online that lets you share the diagrams that you’ve created in Visual Paradigm with others even they are not using Visual Paradigm product. You can also collect their feedback after they have view your diagrams. You can share to user on specific diagram(s) only, or share on the entire project. To share entire project:
Wireframe is a very effective tool for develop screen mock-up. It’s simple and easy-to-draw nature allow developers quickly develop the screen design. This allow stakeholders foresee how the new system look like before you really develop it. This article will show you how to create a simple iPhone wireframe using Open API.
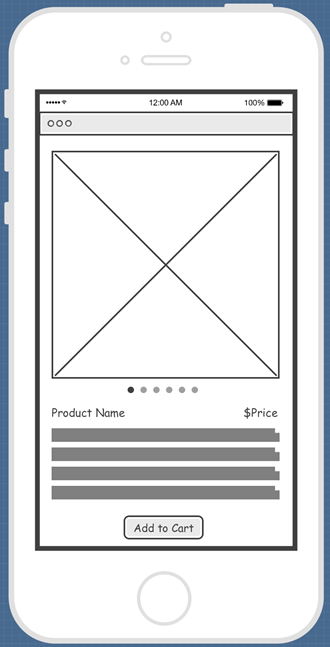
iPhone wireframe create with Open API
Doc. Composer allow user retrieve and output model details by creating custom templates. In this article we will create customize template to output the associations for classes under specific scope.
![]() Changing product edition is particularly necessary when you want to test the functionalities supported by different editions of Visual Paradigm during evaluation period, or reserve license in particular edition for your teammate when running in floating license environment. This article will show you how to switch the edition of your Visual Paradigm software. Read more
Changing product edition is particularly necessary when you want to test the functionalities supported by different editions of Visual Paradigm during evaluation period, or reserve license in particular edition for your teammate when running in floating license environment. This article will show you how to switch the edition of your Visual Paradigm software. Read more