

Generate CRUD chart for DFD using Open API
![]() CRUD (Create, Read, Update & Delete) are the four basic operations which being performed on data. When analyzing a system, relaying various activities and data together with a CRUD chart can help to understand the relationships between different activities, and how they being link together by the data. Visual Paradigm support creating CRUD chart for any model elements in the project. Besides manually create the CRUD chart you can also generate programmatically using Open API. In this article we will teach you how to generate CRUD chart using Open API.
CRUD (Create, Read, Update & Delete) are the four basic operations which being performed on data. When analyzing a system, relaying various activities and data together with a CRUD chart can help to understand the relationships between different activities, and how they being link together by the data. Visual Paradigm support creating CRUD chart for any model elements in the project. Besides manually create the CRUD chart you can also generate programmatically using Open API. In this article we will teach you how to generate CRUD chart using Open API.
Suppose we have the DFD like this. The flows from data store to process represent it is retrieving data from data store, and flows from process to data store represent it is modifying data to data store. In addition the flow named Create and Delete indicate the process is creating data and deleting data to data store.
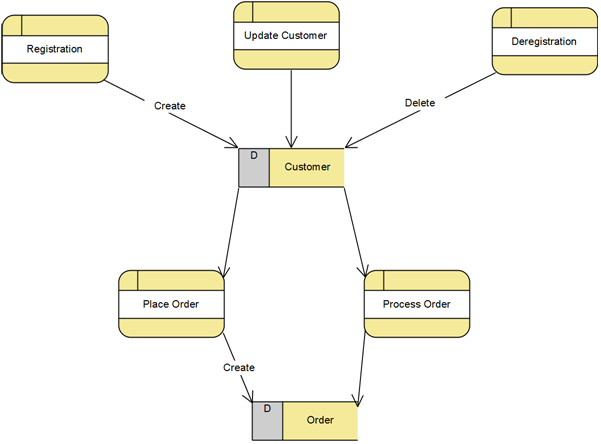
Sample DFD
Create Chart Diagram
First we start with creating a new chart diagram. We can use the DiagramManager.createDiagram method to create the chart diagram.
// Create chart diagram
IChartDiagramUIModel chartDiagram = (IChartDiagramUIModel) ApplicationManager.instance().getDiagramManager().createDiagram(IDiagramTypeConstants.DIAGRAM_TYPE_CHART_DIAGRAM);
Configure column and row header
Once the chart diagram being created we then have to configure the model type for the columns and rows. To specify the header we have to create two IChartHeader, one for the column and one for the row. We then specify it is for the IDFProcess and IDFDataStore. After that retrieve the model element ID for the header and specify it to the chart diagram.
// Create column header for the chart and specify its height
IChartHeader colHeader = IModelElementFactory.instance().createChartHeader();
colHeader.setType(IChartHeader.TYPE_MODEL_ELEMENT);
    colHeader.setValue(IModelElementFactory.MODEL_TYPE_DF_PROCESS);
chartDiagram.setColumnsAddresses(new String[] {colHeader.getId()});
chartDiagram.setColumnHeaderHeight(120);

// Create row header for the chart and specify its width
IChartHeader rowHeader = IModelElementFactory.instance().createChartHeader();
rowHeader.setType(IChartHeader.TYPE_MODEL_ELEMENT);		rowHeader.setValue(IModelElementFactory.MODEL_TYPE_DF_DATA_STORE);
chartDiagram.setRowsAddresses(new String[] {rowHeader.getId()});
chartDiagram.setRowHeaderWidth(80);
Specify column and row data
When header is ready we then specify the data for the chart. We retrieve the DFD Process model and DFD Data Store model from current opening project, and retrieve their model element IDs into array and set it into chart diagram.
// Obtain the current opening project
IProject project = ApplicationManager.instance().getProjectManager().getProject();

// Retrieve all DFD data stories and processes into array
IModelElement[] processes = project.toAllLevelModelElementArray(IModelElementFactory.MODEL_TYPE_DF_PROCESS);
IModelElement[] dataStores = project.toAllLevelModelElementArray(IModelElementFactory.MODEL_TYPE_DF_DATA_STORE);

// Walk through the model element array to retrieve model element's ID and store into a String array
String[] processIDs = toIDArray(processes);
String[] dataStoreIDs = toIDArray(dataStores);
private String[] toIDArray(IModelElement[] elements) {
  if (elements != null) {
    String[] ids = new String[elements.length];
    for (int i = 0; i < elements.length; i++) {
      ids[i] = elements[i].getId();
    }
    return ids;
  }
  return null;
}
Specify chart type for the diagram
Visual Paradigm build-in support CRUD and RACI chart. To create CRUD chart we have to retrieve the collection of chart type in project, then obtain the chart type which named as CRUD and set it to the diagram.
// Retrieve chart type for CRUD chart from project default chart type container and specify it to chart diagram
IChartTypeContainer chartTypeContainer = (IChartTypeContainer) project.toAllLevelModelElementArray(IModelElementFactory.MODEL_TYPE_CHART_TYPE_CONTAINER)[0];
IChartType chartType = chartTypeContainer.getChartTypeByName("CRUD");
chartDiagram.setChartTypeId(chartType.getId());
After that we obtain the chart code form chart type for later use.
// Retrieve chart codes for later use
IChartCode codeCreate = null;
IChartCode codeRead = null;
IChartCode codeUpdate = null;
IChartCode codeDelete = null;
IChartCode[] codes = chartType.toCodeArray();

for (IChartCode code : codes) {
  switch (code.getName()) {
  case "Create" :
    codeCreate = code;
    break;
  case "Read" :
    codeRead = code;
    break;
  case "Update" :
    codeUpdate = code;
    break;
  case "Delete" :
    codeDelete = code;
    break;
  }
}
Fill in chart code between column and row elements
Now here is the most important step, to specify the relation between elements. We analyze the direction of the relationships to determine it should be a read access or update access. Since the DFD didn’t tell the time sequence, we determine the process is creating or deleting data based on its name. i.e. message from Process to Data Store and name as Create will be a create action, and message from Process to Data Store and named as Delete will be a delete action.
// Analyze the relationships on the process.
// If the relationship is to data store and named as "Create" then consider the process creating data.
// If the relationship is to data store and named as "Delete" then consider the process deleting data.
// If the relationship is to data store with no name then consider the process is updating data.
// If the relationship from data store then consider the process is reading data.

// Walk through the process models
for (IModelElement modelElement : processes) {
  if (modelElement instanceof IDFProcess) {
    IDFProcess process = (IDFProcess) modelElement;
    // Analyze on the from relationship of the process
    ISimpleRelationship[] fromRelationships = process.toFromRelationshipArray();
    if (fromRelationships != null && fromRelationships.length > 0) {
      for (ISimpleRelationship fromRelationship : fromRelationships) {
        IModelElement toElement = fromRelationship.getTo();
        // If the relationship going to data store then create chart relationship
        // and specify chart code according to the name of the relationship
        if (toElement instanceof IDFDataStore) {
          IChartRelationship chartRelationship = IModelElementFactory.instance().createChartRelationship();
          chartRelationship.setFrom(process);
          chartRelationship.setTo(toElement);
          // Consider process is creating data if the relationship named as "Create"
          if ("Create".equals(fromRelationship.getName())) {
            chartRelationship.setCode(codeCreate);
            // Consider process is deleting data if the relationship named as "Delete"
          } else if ("Delete".equals(fromRelationship.getName())) {
            chartRelationship.setCode(codeDelete);
            // Otherwise consider process is updating data
          } else {
            chartRelationship.setCode(codeUpdate);
          }
        }
      }
    }
    // Analyze on the to relationship of the process
    ISimpleRelationship[] toRelationships = process.toToRelationshipArray();
    if (toRelationships != null && toRelationships.length > 0) {
      for (ISimpleRelationship toRelationship: toRelationships) {
        IModelElement fromElement = toRelationship.getFrom();
        // If the relationship is from data store then create
        // chart relationship and specify chart code as update
        if (fromElement instanceof IDFDataStore) {
          IChartRelationship chartRelationship = IModelElementFactory.instance().createChartRelationship();
          chartRelationship.setFrom(fromElement);
          chartRelationship.setTo(process);
          chartRelationship.setCode(codeRead);
        }
      }
    }
  }
}
Show up the chart
Finally we can show up the chart diagram by calling DiagramManager.openDiagram().
// Show up the chart diagram
ApplicationManager.instance().getDiagramManager().openDiagram(chartDiagram);
Sample Plugin
The sample plugin attached and project demonstrate how to generate CRUD chart from the DFD. After you deploy the plugin into Visual Paradigm you can open the sample project, then press the Chart Diagram button under Plugins tab to create the CRUD chart. Please note that Chart diagram is supported in Standard Edition, to run this plugin you will need to have Visual Paradigm Standard Edition (or above).
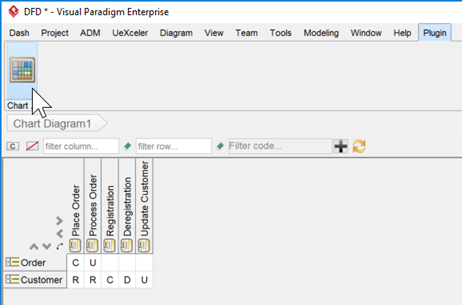
Execute sample plugin to generate CRUD for DFD
Download Sample Plugin
Download sample project (require version 14.0 or above)
Related Know-how |
Related Link |
Leave a Reply
Want to join the discussion?Feel free to contribute!