Create a Radar Chart Using Open API
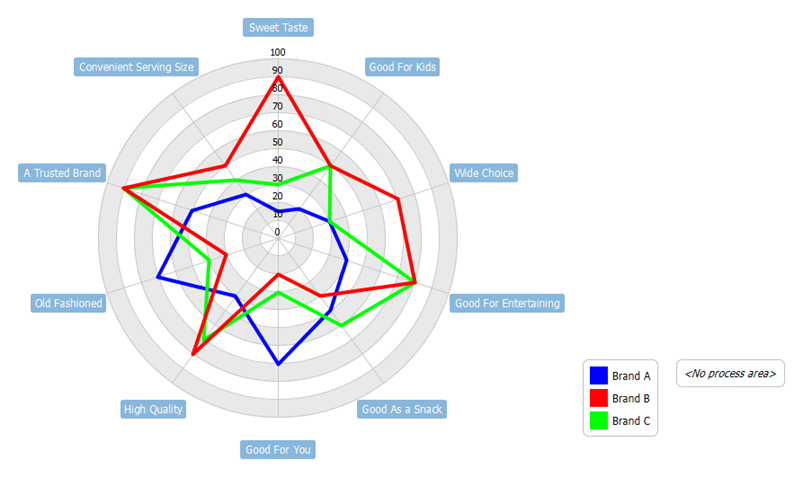
Radar Charts are mostly used in comparing data flows’ attributes visually. In this article, you will be shown how to create a radar chart using Open API.

The radar chart will be created by the plugin.
Create Blank Chart
First create a blank radar chart. A blank diagram can be created using the method DiagramManager.createDiagram().
//Create Blank Radar Chart
DiagramManager diagramManager = ApplicationManager.instance().getDiagramManager();
IMaturityAnalysisUIModel radarChart = (IMaturityAnalysisUIModel) diagramManager.createDiagram(IDiagramTypeConstants.DIAGRAM_TYPE_MATURITY_ANALYSIS);
radarChart.setName("Sample Radar Chart");
Create Chart Model
Different with other diagrams, that elements’ coordinates has to be specified manually, a radar chart’s elements are automatically render by the model. The model of a radar chart is IMaturityAnalysisModel, which can be created using method IModelElementFactory.instance().createMaturityAnalysisModel().
//Create Radar Chart Model
IMaturityAnalysisModel radar = IModelElementFactory.instance().createMaturityAnalysisModel();
radarChart.setMaturityAnalysisModelAddress(radar.getAddress());
Create Factors (Attributes, Variables)
Once the model is created, we can then create the factors. A factor can be created from IModelElementFactory.
//Create Factors
IMaturityAnalysisMaturityFactor sweetTaste = IModelElementFactory.instance().createMaturityAnalysisMaturityFactor();
sweetTaste.setName("Sweet Taste");
//Add the factor to the model
radar.addMaturityFactor(sweetTaste);
Create Stages (Data Flows)
When the factors are created, we can then create some stages using IModelElementFactory.
//Create Stages
IMaturityAnalysisStage brandA = IModelElementFactory.instance().createMaturityAnalysisStage();
brandA.setName("Brand A");
brandA.setColor(Color.BLUE.getRGB());
//Add stage to the model
radar.addStage(brandA);
Create Factor Values (Markers)
When all factors and stages are created, we can now create the factor values. A factor value is first created by IModelElementFactory, stating its factors and values, then will be added to the stage using IMaturityAnalysisStage.addMaturityFactorValue().
//Create factor values
IMaturityAnalysisMaturityFactorValue brandASweetTaste = IModelElementFactory.instance().createMaturityAnalysisMaturityFactorValue();
brandASweetTaste.setMaturityFactor(sweetTaste);
brandASweetTaste.setValue(0.15);
//Add factor value to the stage
brandA.addMaturityFactorValue(brandASweetTaste);
For continence, you can make a private method the use the method to create more factor values quickly. You can create the method like this:
private IMaturityAnalysisMaturityFactorValue addValue(IMaturityAnalysisMaturityFactor variable, double rating) {
  IMaturityAnalysisMaturityFactorValue v = IModelElementFactory.instance().createMaturityAnalysisMaturityFactorValue();
  v.setMaturityFactor(variable);
  v.setValue(rating/100);
  return v;
}
You can then use the same method to create other factor values:
//You can use the above method to create more factor values efficiently
brandA.addMaturityFactorValue(addValue(goodForKids,20));
brandA.addMaturityFactorValue(addValue(wideChoice, 30));
brandA.addMaturityFactorValue(addValue(goodForEntertaining, 40));
brandA.addMaturityFactorValue(addValue(goodAsASnack, 50));
brandA.addMaturityFactorValue(addValue(goodForYou, 70));
brandA.addMaturityFactorValue(addValue(highQuality, 40));
brandA.addMaturityFactorValue(addValue(oldFashioned, 70));
brandA.addMaturityFactorValue(addValue(trustedBrand, 50));
brandA.addMaturityFactorValue(addValue(convenientServingSize, 30));
Show the Diagram
Finally, show up the diagram.
//Show Up Diagram
diagramManager.openDiagram(radarChart);
Sample Plugin
The sample plugin demonstrate how to create radar chart using Open API. After you deploy the plugin into Visual Paradigm you can then click the plugin button in the application toolbar to trigger it.

Download Plugin
You can click this link to download the sample plugin.
Related Know-how |
Related Link |


Leave a Reply
Want to join the discussion?Feel free to contribute!