Define Stereotypes in Organization Chart
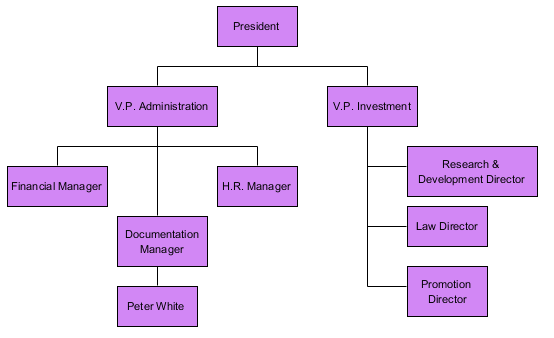
An organization chart is a diagram that visualizes the formal structure of an organization as well as the relationships and relative ranks of its positions. However, it is hard to tell which unit indicates a person and which unit represents a person’s position. With VP-UML, you are able to distinguish each unit through the application of stereotypes. This article will teach you how to define stereotypes in organization chart.
Let’s define stereotypes in ABC International as the example:
- Select Modeling > Configure Stereotypes…from the main menu.
- In the Configure Stereotypes window, explore Organization Chart folder and select Unit.
- Click Add button to add a new stereotype.
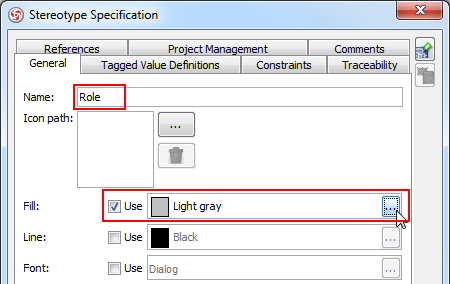
- When the Stereotypes Specification dialog box pops out, you can enter Role as the name, check Fill and then select Light gray as the color for stereotype. Click OK to confirm.
- Repeat the previous step to create one more stereotype. Name it as Person and color it with Pink.
- Click OK button in Configure Stereotypes dialog box.
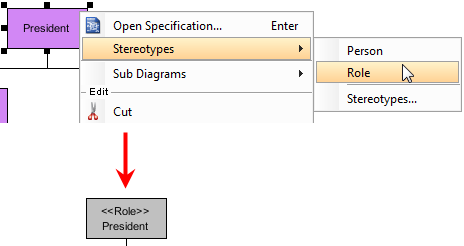
- Next, we can define the unit in organization chart with stereotype. Right click on President unit and select Stereotypes > Role from the pop-up menu. As you see, the President unit turns into light gray with role as stereotype.
- Repeat the previous step to define Financial Manager, Documentation Manager, H.R. Manager, Research & Development Director, Law Director and Promotion Director as Role.
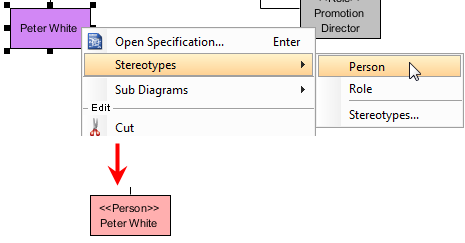
- Now, define Peter White as Person. Right click on Peter White unit and select Stereotypes > Person from the pop-up menu.
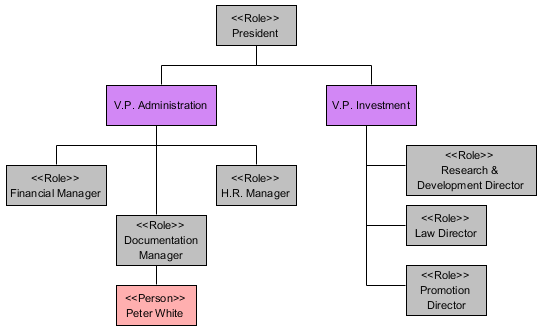
The completed diagram is shown as follows:
How to try the sample
Download stereotype-sample and unzip it to get the .vpp file.




Leave a Reply
Want to join the discussion?Feel free to contribute!