Data Visualization with Google Sheets
Visual Paradigm support visualize your data into various charts. This feature gives you valuable insights to your data. The data can be visualized by entering with the build-in spreadsheet tool, upload of Excel file, or directly link from Google Sheets. In this article we will show you how to feed in data to your chart by link to Google Sheets.
Configure Google Sheet
- Open you Google Sheet.
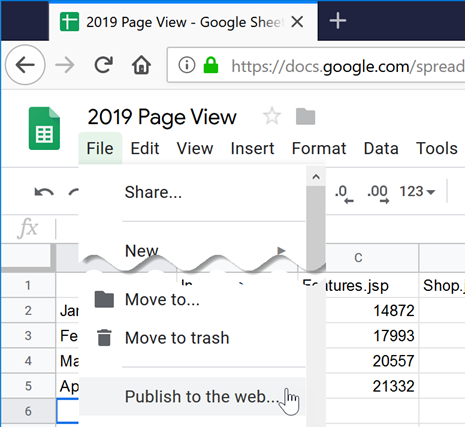
- Go to Files > Publish to the web…
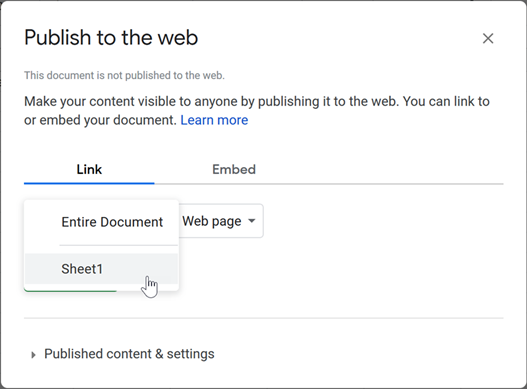
- Select the worksheet.
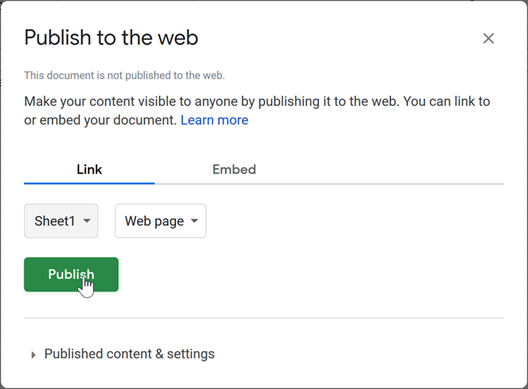
- Press Publish button to publish it.
- Close the Publish to the web dialog.
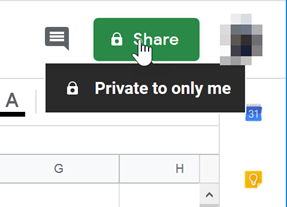
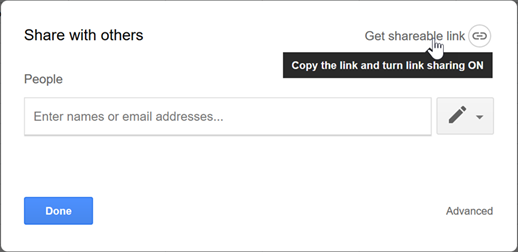
- Press the Share button at the top right of the spreadsheet.
- Press the Get shareable link button to obtain the share link of your spreadsheet.
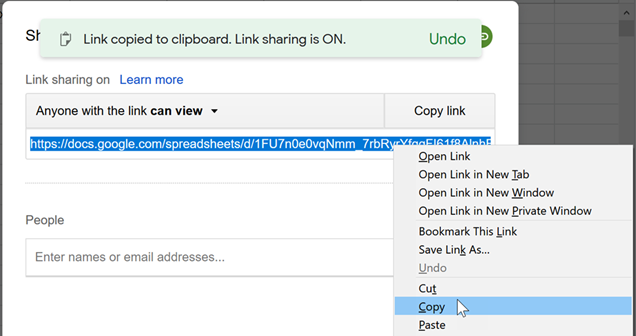
- Copy the share link to clipboard.
Configure Your Chart
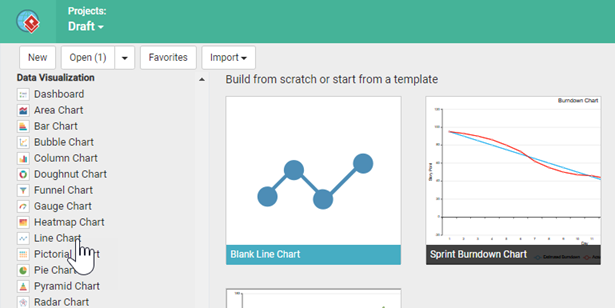
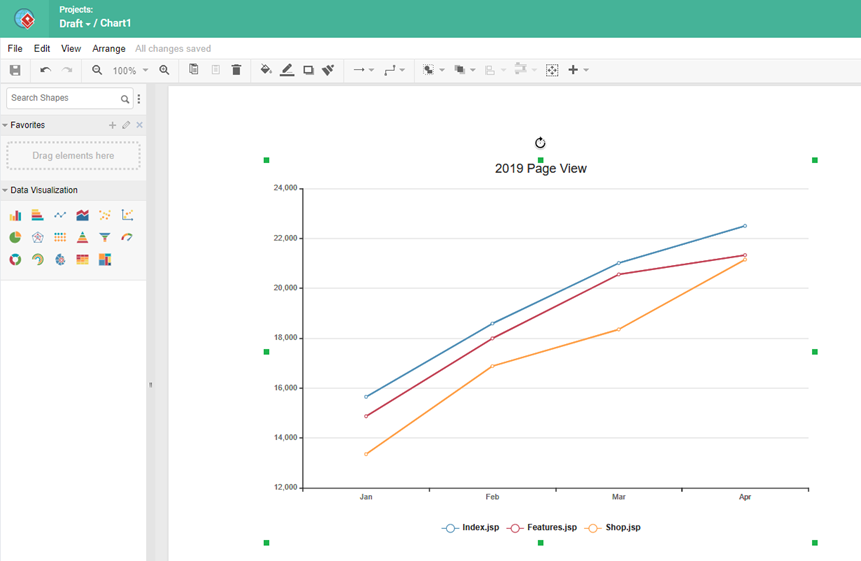
- Create any chart using the Data Visualization tool.
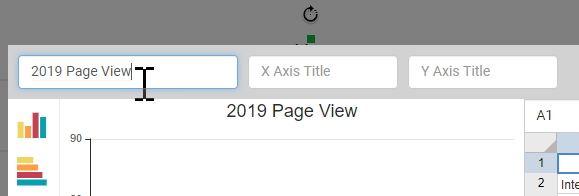
- Specify the name of the chart.
- Press the Options button in chart editor to bring up the option settings.
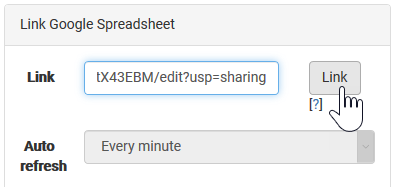
- Paste the share link of your spreadsheet into the Link field under Link to Google Sheet, then press the Link button to establish the linkage.
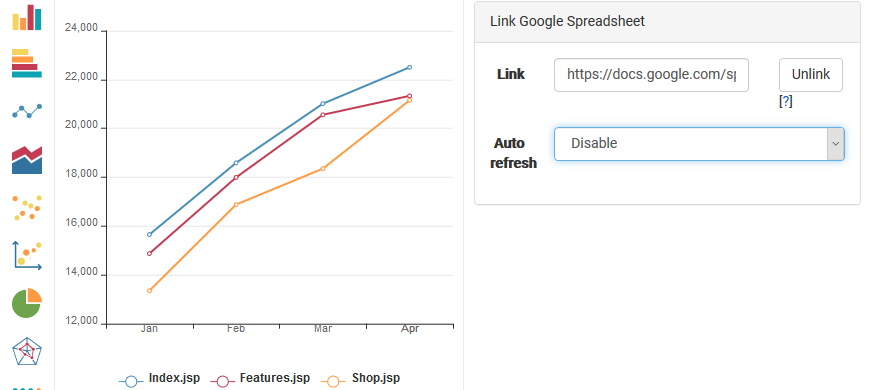
- The preview of the chart will be updated according to the data in your spreadsheet.
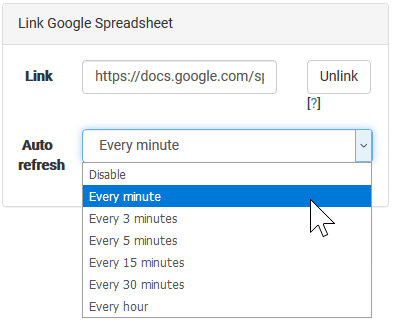
- You can also turn on the Auto refresh of the chart to have it automatically pull the data from your Google Sheet in specified interval.
- Press on the chart editor to close the configuration and have your chart updated.
Related Know-how |
Related Link |



Leave a Reply
Want to join the discussion?Feel free to contribute!