

Collect JVM Thread dump for Visual Paradigm’s Application
To collect Visual Paradigm’s JVM thread dump:
- Download Temurin 11.x JDK Zip package from https://adoptium.net/temurin/releases?version=11&os=any&arch=any
- Unzip the downloaded JDK package.
- Startup Visual Paradigm application, and repeat the problem you experienced.
- Find out the process ID of Visual Paradigm application:
- Windows:
- Open Task Manager.
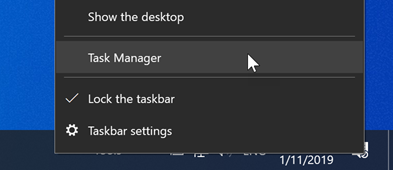
Open Task Manager
- View More Details.
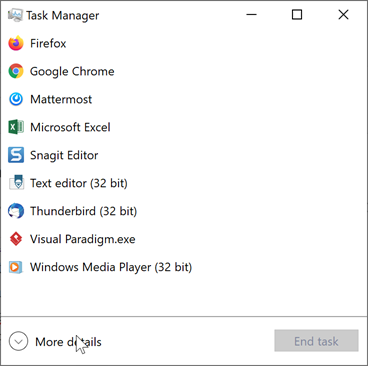
Show more detials in Task Manager
- Locate Visual Paradigm process to see its PID. In case the PID column is not showing you can right click on the table header to bring it up.
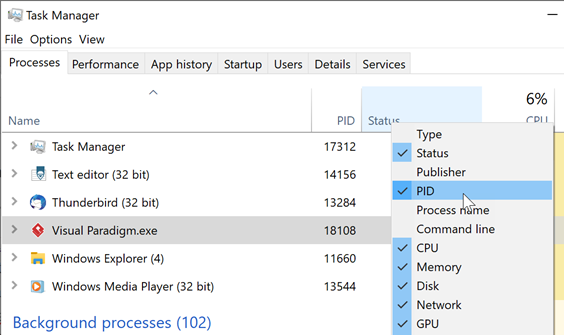
Locate Visual Paradigm process
- Open Task Manager.
- Linux:
- Using ps or pgrep command
- Mac
- Go to Applications > Utilities to open Activity Monitor.
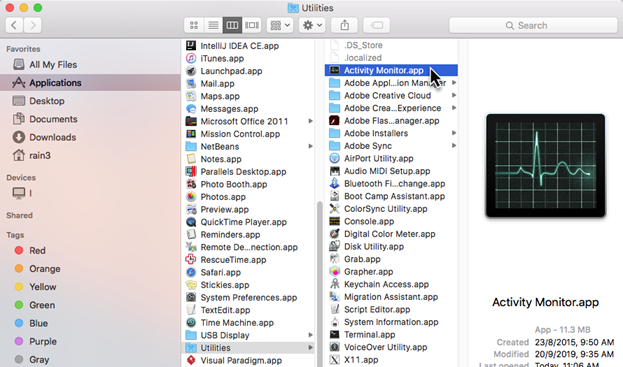
Open Activity Monitor
- Locate Visual Paradigm process to see its PID. In case the PID column is not showing you can right click on the table header to bring it up.
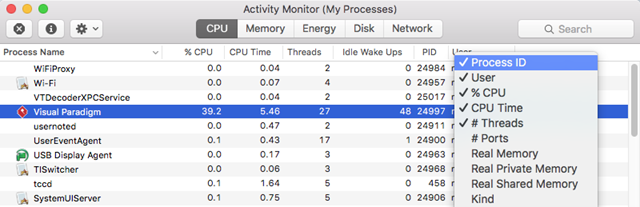
Locate VP Process on Mac
- Go to Applications > Utilities to open Activity Monitor.
- Windows:
- Open Command Prompt or Terminal, navigate to the bin folder of the unzipped AdoptOpenJDK using CD command.
- Execute the following command by replace %pid% with the process ID of VP process.
- Window
- jstack %pid% > dump.txt
- Linux/Mac
- ./jstack %pid% > dump.txt
- Window
- Collect the generated dump.txt as well as latest vp application log file and send to VP team for diagnosis.
Related Know-how |

Leave a Reply
Want to join the discussion?Feel free to contribute!