Create iPhone Wireframe Using Open API
Wireframe is a very effective tool for develop screen mock-up. It’s simple and easy-to-draw nature allow developers quickly develop the screen design. This allow stakeholders foresee how the new system look like before you really develop it. This article will show you how to create a simple iPhone wireframe using Open API.
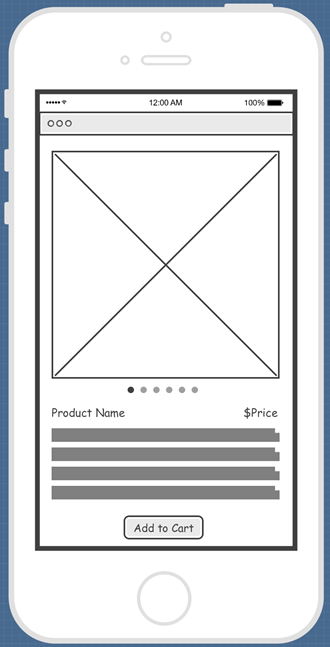
iPhone wireframe create with Open API