

Create an Organization Chart Using Open API
Organization chart is a useful tool for showing an organization’s structure, indicating its parts and positions’ relationships and ranks. This article will demonstrate how to create an organizational chart using Open API.
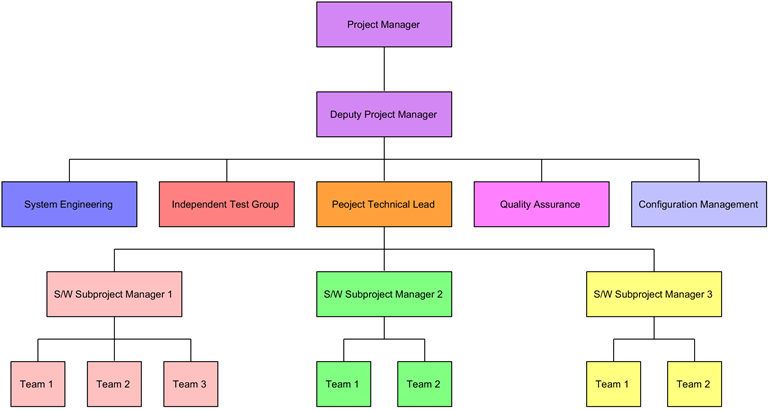
The organization chart will be created by the plugin.
 Component Diagram in
  Deployment Diagram in