

Create an Implementation Plan Diagram Using Open API
Implementation Plan is a project management tool that shows how a software project will evolve at a high level. This article will show you how to create an Implementation Plan Diagram using Open API.
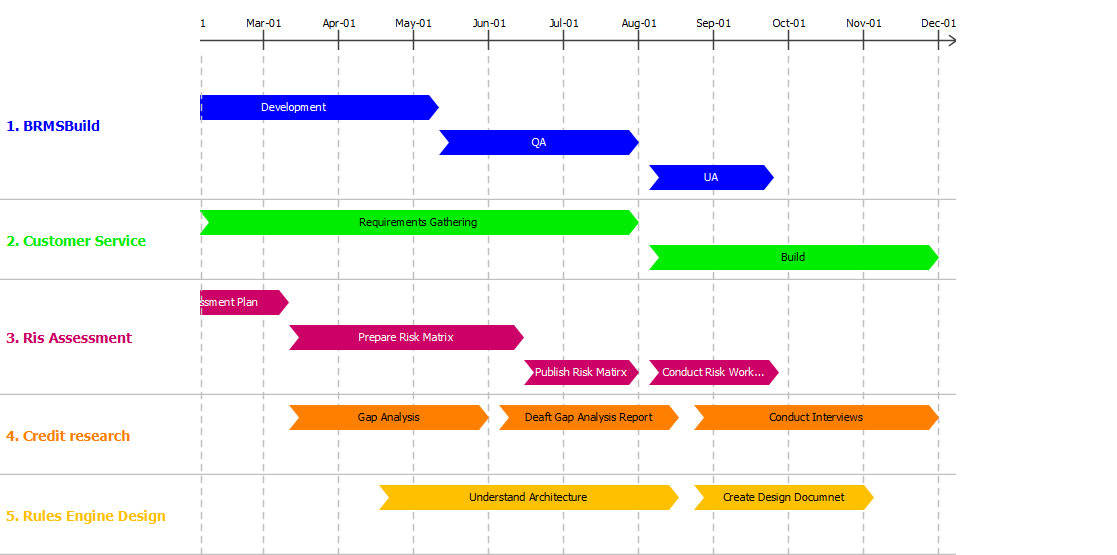
The Implementation Plan Diagram will be created by the plugin.
Debug your plugins with IntelliJ IDEA
 Visual Paradigm Open API provides an interface for developers to develop plugins and extend the functionalities of Visual Paradigm. During development of the plugin constant modifications will be done to fine tune your plugin. Instead of deploy the plugin to VP every time after you made changes, you can directly launch VP with your plugin from IntelliJ IDEA to perform debugging. This article teaches how to configure IntelliJ IDEA to perform debugging on your plugins.
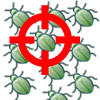
Create a PERT Diagram Using Open API
Program Evaluation Review Technique (PERT) is a technique to schedule, organize and coordinate tasks of a project. This article will demonstrate how to create a PERT Chart using Open API.
The PERT Chart will be created by the plugin
How to grant user write permission only for branch projects
 Branching is a technique in version control for user to have different parts of the software development in parallel. By creating branch you can make the trunk as the stable release of your software, and doing unstable development work on branch. When manage your model project with VP Online or on-premises Teamwork Server you can grant user the access permission on the project. By combine the use of branches you can grant write permission on trunk only for the project manager, and all others only have write permission on the branch they working on. In this article we will show you how this works.
Read more
How to Create Data Dictionary Report
Doc. Composer is a powerful document generator which allows user to output the details of the models using customized templates. In this article we will create customize template to generate a data dictionary for the class models and its attributes in your project.
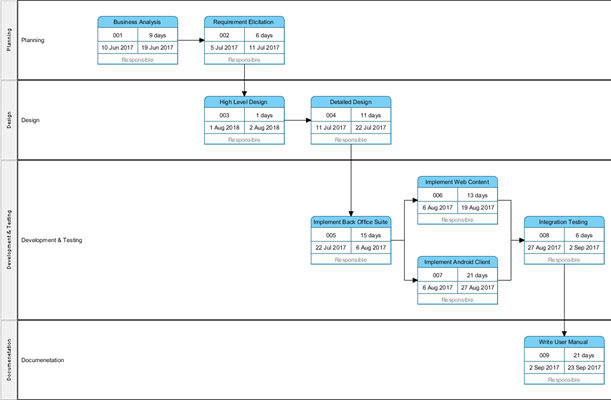
Create a Radar Chart Using Open API
Radar Charts are mostly used in comparing data flows’ attributes visually. In this article, you will be shown how to create a radar chart using Open API.
The radar chart will be created by the plugin.
Create an Organization Chart Using Open API
Organization chart is a useful tool for showing an organization’s structure, indicating its parts and positions’ relationships and ranks. This article will demonstrate how to create an organizational chart using Open API.
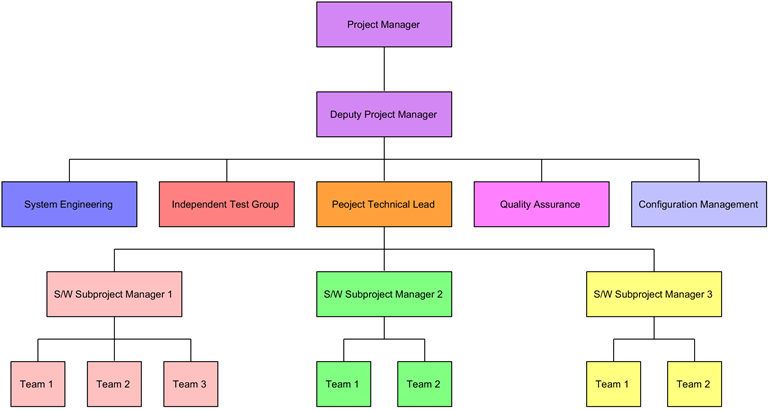
The organization chart will be created by the plugin.