Create a Radar Chart Using Open API

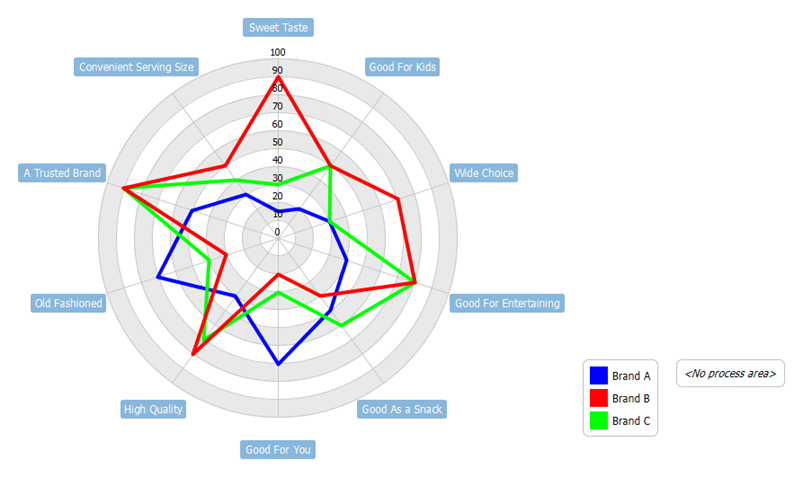
Radar Charts are mostly used in comparing data flows’ attributes visually. In this article, you will be shown how to create a radar chart using Open API.

The radar chart will be created by the plugin.

Read more

Create a PERT Diagram Using Open API

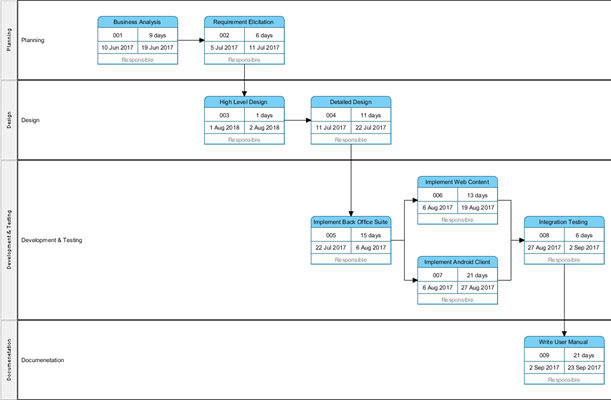
Program Evaluation Review Technique (PERT) is a technique to schedule, organize and coordinate tasks of a project. This article will demonstrate how to create a PERT Chart using Open API.

The PERT Chart will be created by the plugin

Read more

How to grant user write permission only for branch projects

tomcat-thumbBranching is a technique in version control for user to have different parts of the software development in parallel. By creating branch you can make the trunk as the stable release of your software, and doing unstable development work on branch. When manage your model project with VP Online or on-premises Teamwork Server you can grant user the access permission on the project. By combine the use of branches you can grant write permission on trunk only for the project manager, and all others only have write permission on the branch they working on. In this article we will show you how this works.
Read more

How to enable VP Desktop Client access for your VP Online

VP Online is a web based platform support creating various diagrams and charts. For VP Desktop user they can access to their VP Online space and use it as the central repository for their project files. To enable VP Desktop Client access for your VP Online workspace:

Read more

Subscribed to VP Online but my account still shows I’m using Express Edition?

I’ve already subscribed to VP Online but my account still shows I’m on the free Express Edition!? This probably caused by your licenses is subscribed on a different email address. You can associate your subscribed license to your existing VP Online account. To do this:

Read more

Create an Organization Chart Using Open API

Organization chart is a useful tool for showing an organization’s structure, indicating its parts and positions’ relationships and ranks. This article will demonstrate how to create an organizational chart using Open API.

The organization chart will be created by the plugin.

Read more

How to bring Visual Paradigm’s Modeling menu back in IntelliJ IDEA 2018.2

Visual Paradigm support integrate the modeling environment into different IDEs, including the latest IntelliJ IDEA 2018.2. But for some reason the Visual Paradigm’s Modeling menu may not able to show in IntelliJ IDEA’s main menu bar.

Visual Paradigm’s Modeling menu missing in IntelliJ IDEA 2018.2

To bring the Modeling menu back: Read more

Create a Mind Map Using Open API

Mind Map is a useful tool to visualize information, where relationships between information are drawn. In this article, you will be shown how to create a mind map using Open API.

The Mind Map going to be created

Read more

Create Data Flow Diagram Using Open API

A Data Flow Diagram displays the flow of data of a system, using rectangles and arrows. This article will demonstrate how to create a data flow diagram using Open API.

The diagram will be created by the plugin

Read more

Create Entity-Relationship Diagram Using Open API

Entity-relationship modelling (ER model) becomes handy when building a data base. An ER diagram is being used to indicate relations between different entities in a data base. This article will show you how to create an Entity-Relationship Diagram using Open API.

The ERD going to create by the plugin

Read more