How to use Google Analytics to Track the Performance of your Flipbooks/Slideshows
Google Analytics is a web analytics service offered by Google that tracks and reports website traffic. It is one of the most popular web analytics tool available and is used by website owners and digital marketers to gain insights into how users interact with their websites. Visual Paradigm Online support integrate with Google Analytics. In this article you will learn how to track the performance of your flipbooks and slideshows using Google Analytics.
Create Property in Google Analytics
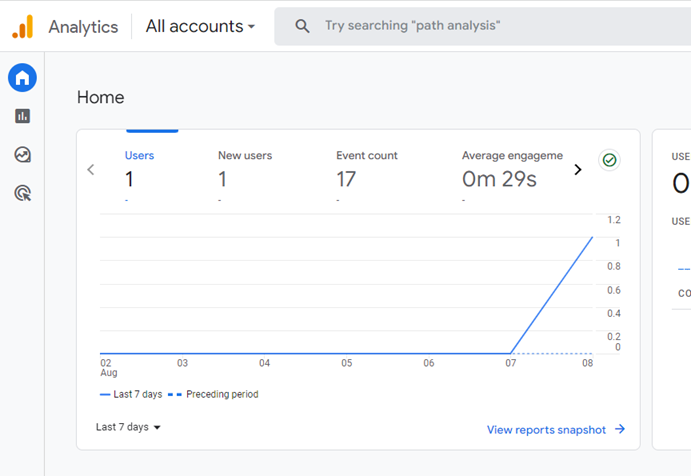
- Login to your Google Analytics account.
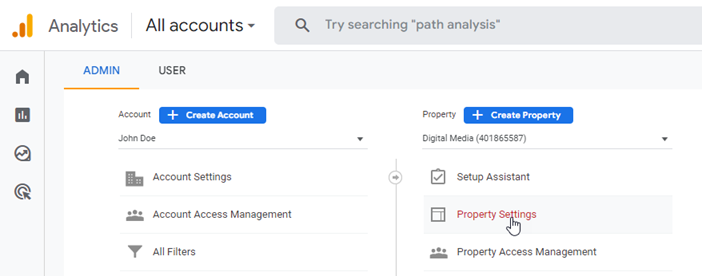
- Press Admin at the bottom left.
- Select Property Settings.
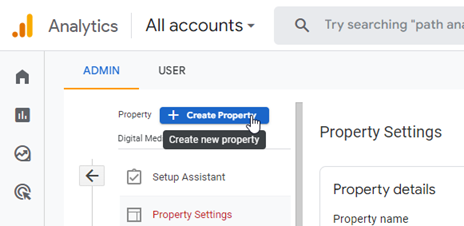
- Press Create Property.
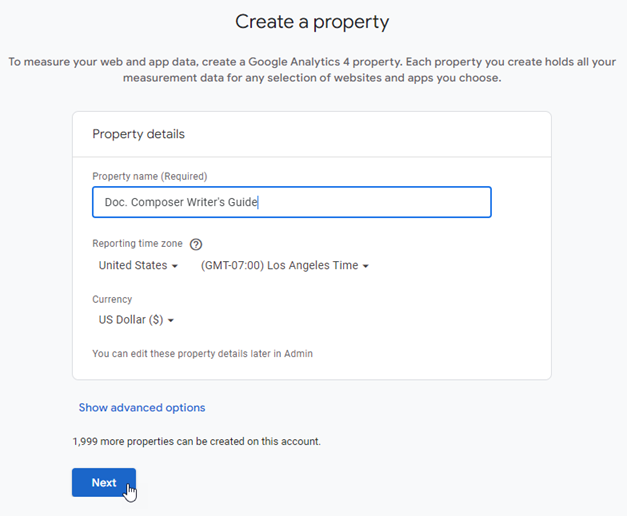
- Define the name of your property, and press Next to proceed.
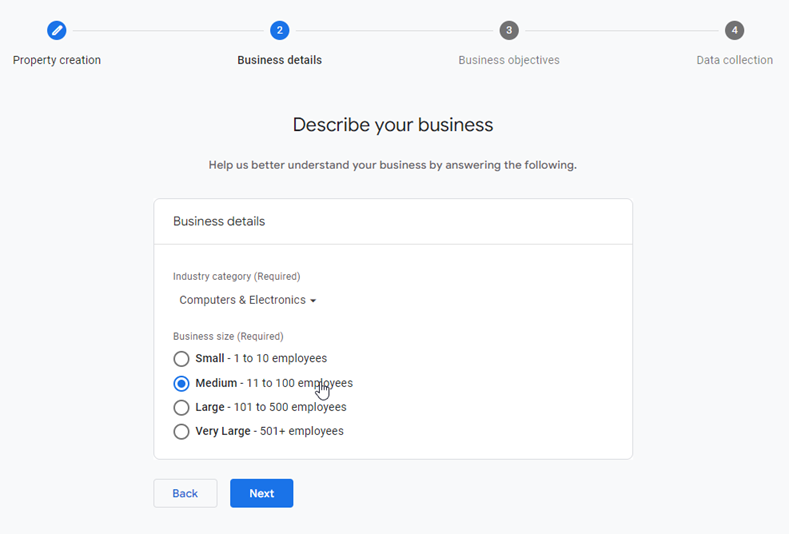
- Specify your Industry category and Business size, then press Next.
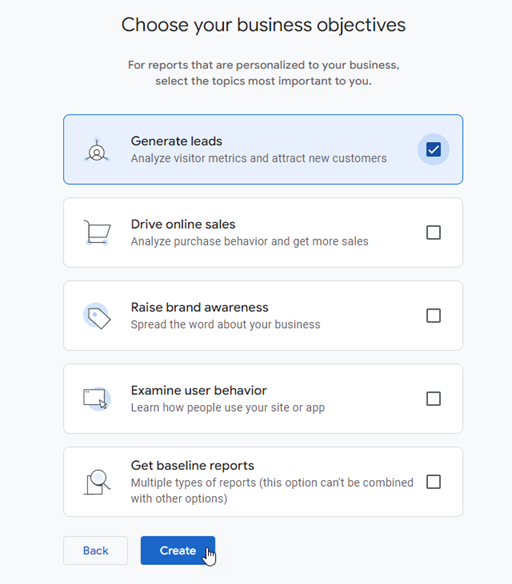
- Choose your business objectives, then press Create button to create the property.
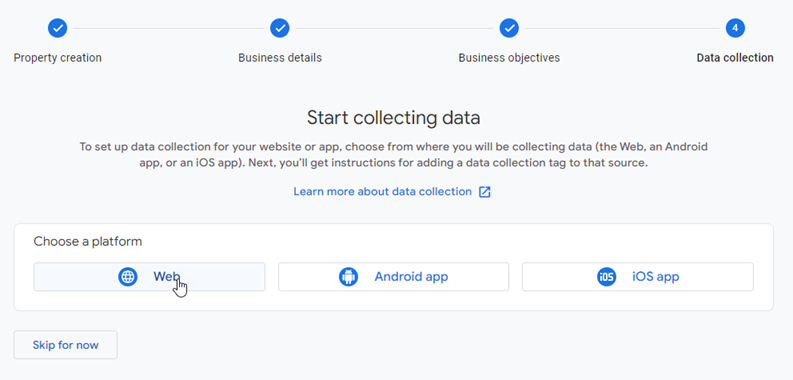
- Choose the platform for collect data.
- Go to your Visual Paradigm Online workspace, select Publications > Flipbooks or Slideshows.
- Copy the URL of your flipbook/slideshow.
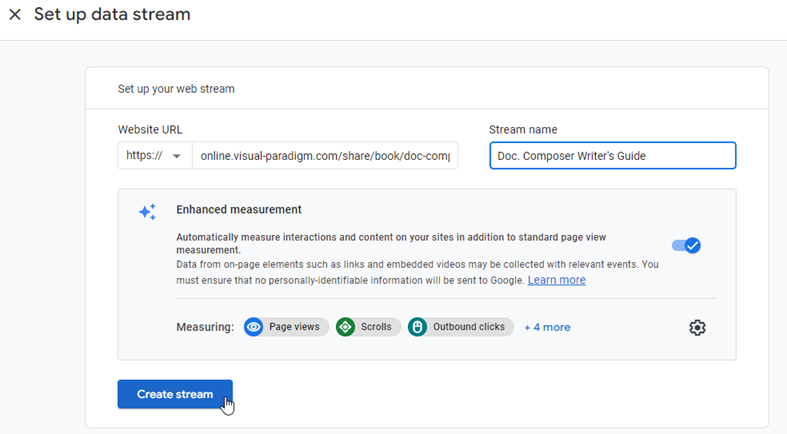
- Go back to Google Analytics, paste the URL to Website URL field, and specify the name of the Stream. After that press Create stream button to create the web stream.
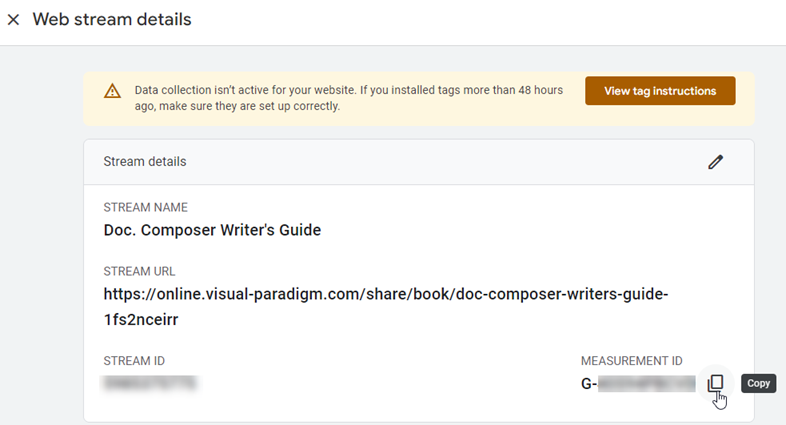
- Once the stream being created the Web stream details button will be shown. Press copy button to copy the Measurement ID of the stream.
Configure Google Analytics in your Flipbook/Slideshows
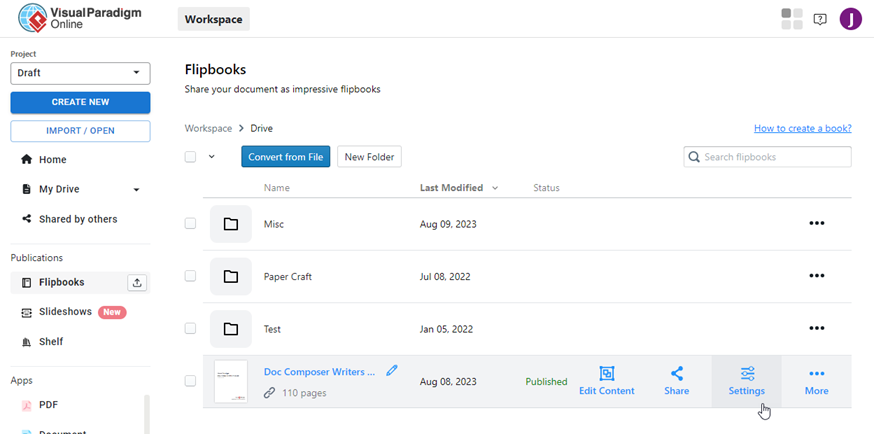
- In your Visual Paradigm Online, mouse over your flipbooks/slideshows and press Settings.
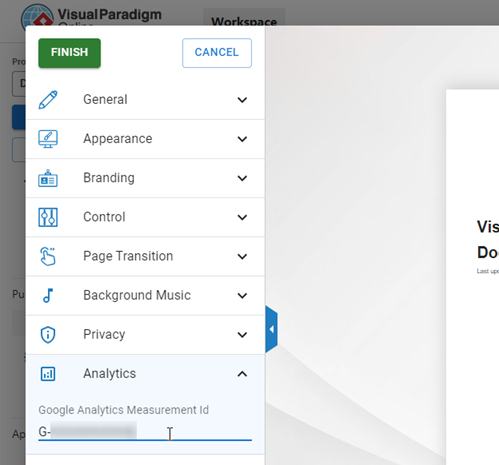
- Expend the Analytics section, and paste the Measurement ID.
- Press Finish to save the change.
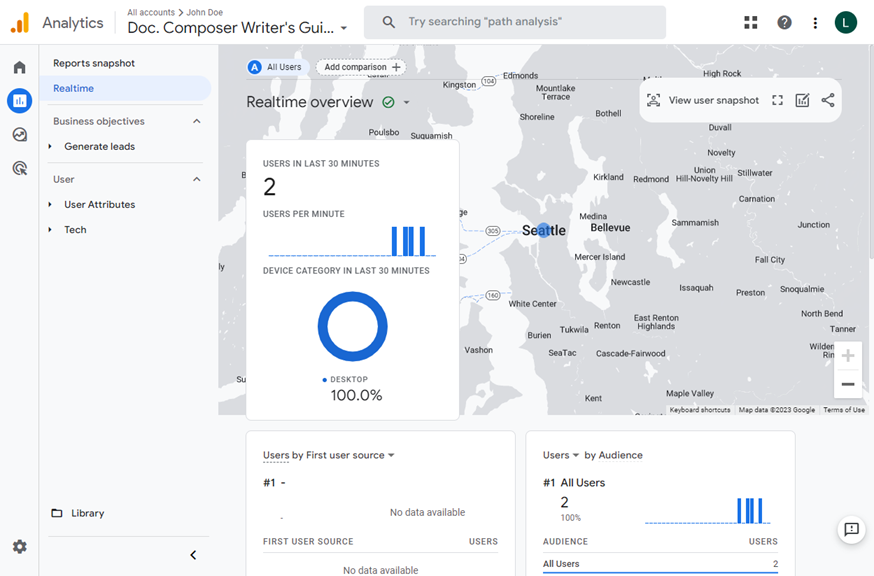
Now your Google Analytics account will report the performance of your flipbook/slideshow.
* Please note that Google Analytics integration require VP Online Combo subscription.





Leave a Reply
Want to join the discussion?Feel free to contribute!