

Specify Max. Value in Radar Chart
Visual Paradigm Online support visualize spread data into various charts. In this article we will show you how to define maximum value for each discipline in your radar chart.
- Double click on the radar chart.
Double click on the chart to edit it
- Define a column for the max value for each discipline.
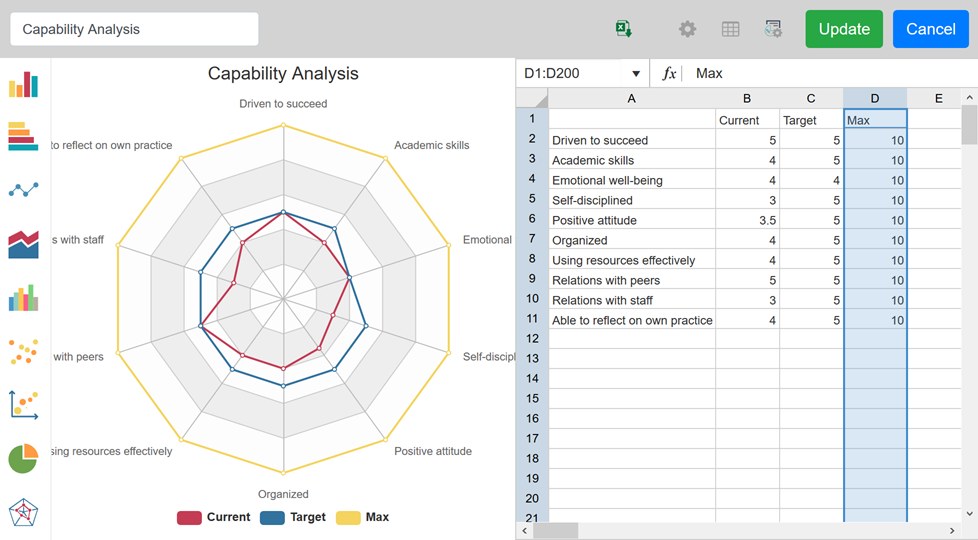
Define max value column
- Press Options button.

Switch to Options list
- Scroll down the options list to locate the Series section and specify which column to be use as maximum value.
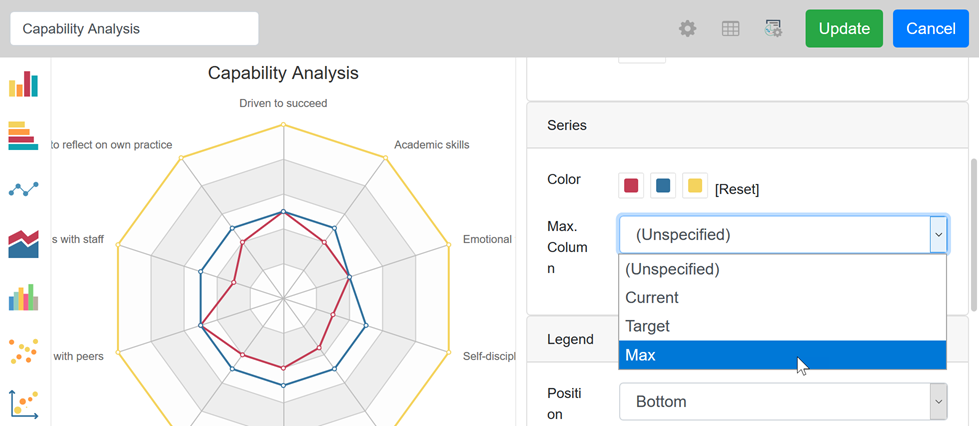
Specify max. value column
- Press Update to confirm the change.
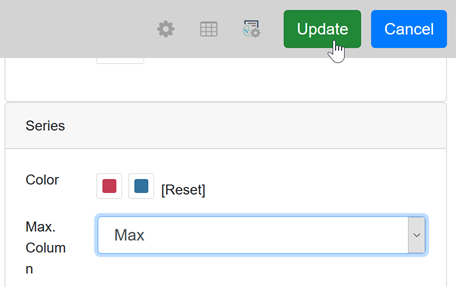
Update the chart
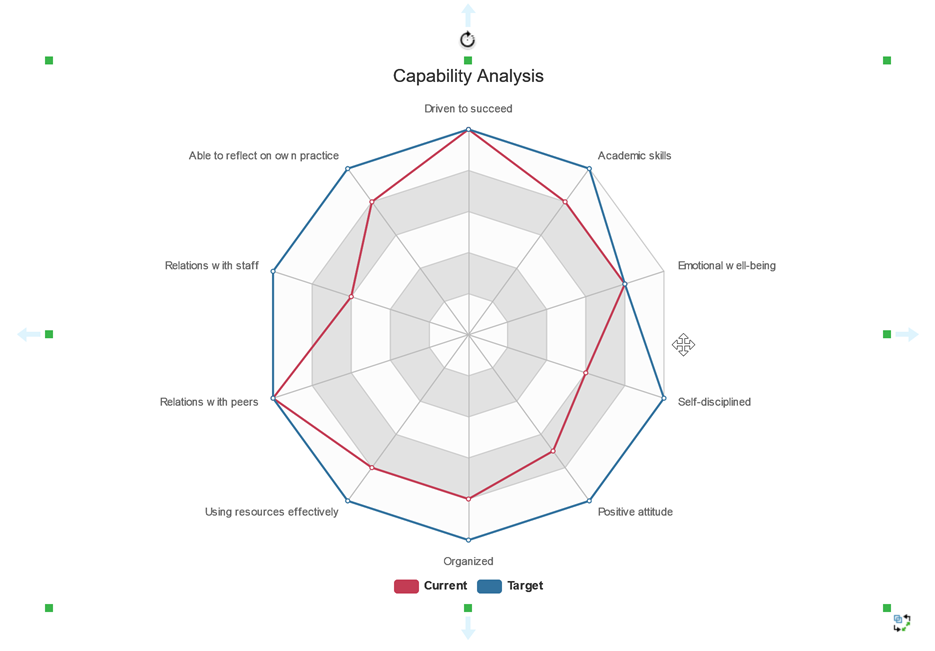
After that the maximum value of the chart will based on the values you defined.
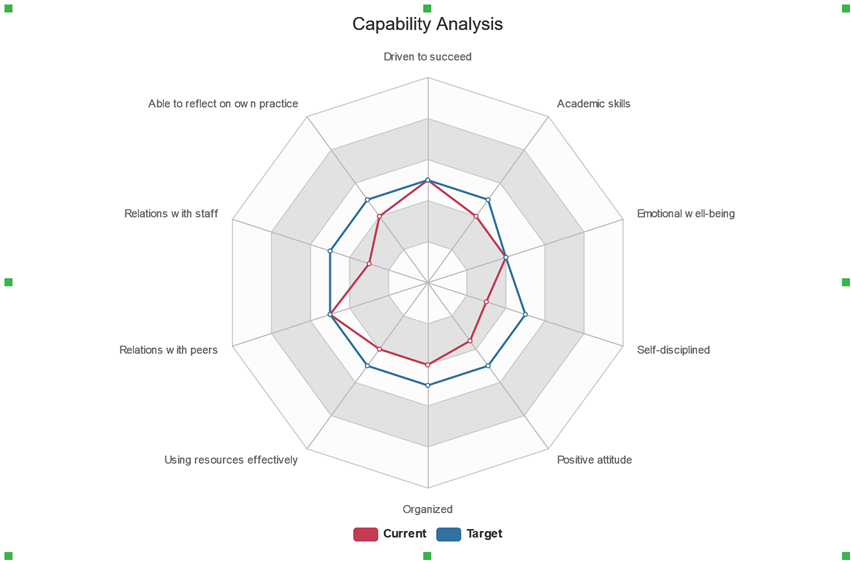
Radar chart with max. value defined
Note that if the data of your chart is imported from Google Sheet then the max value column in step 2 should defined in your Google Sheet.
Leave a Reply
Want to join the discussion?Feel free to contribute!