

Model element’s name not showing on diagram unless it is under editing mode
In my diagram the caption of diagram elements are not showing up unless it is in editing mode.
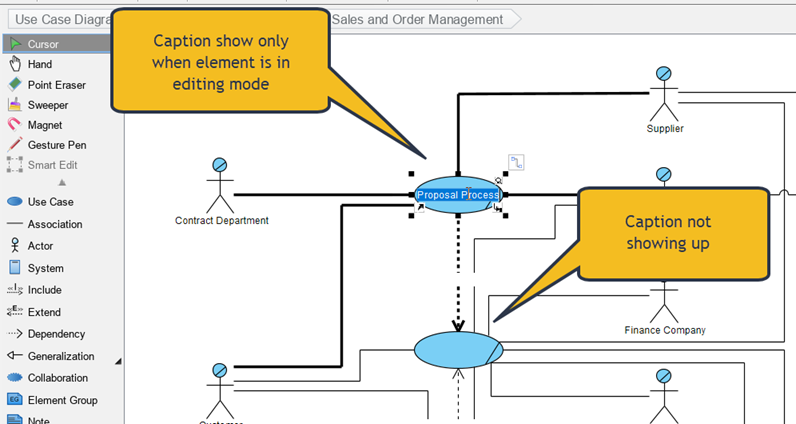
Element caption only show when editing the element
In my diagram the caption of diagram elements are not showing up unless it is in editing mode.
Element caption only show when editing the element
Error was show when trying to enter non-English text to Customer Journey Map (CJM), no matter within Visual Paradigm Desktop application or Teamwork Server’s web interface.
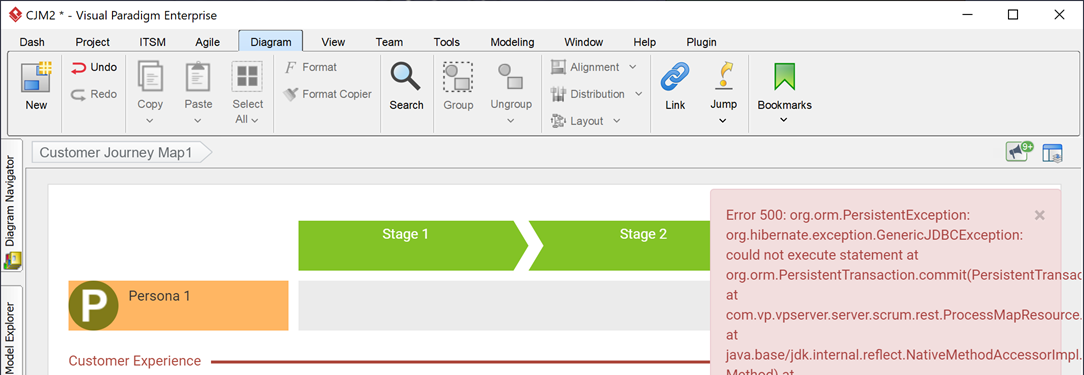
Fail to edit Customer Journey Map (CJM)
Sometimes you may notices that the elements on diagram having a small “a” and “M” icon showing on its top left corner. What does this mean?
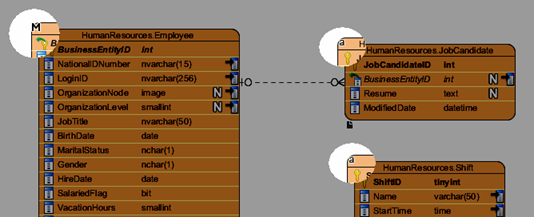
“a” and “M” indicator on diagram
In Visual Paradigm you can specify the default size of the task & sub-process element created in your business process diagram. To specify the default size of task & sub-process:
The ETL Table in Visual Paradigm is a powerful tool which allows you to perform query on your models. It not just allows you to find out the models based using its name or specific text in documentation, but allows you to lookup the models based on the values of its specific properties. In this article we demonstrate how to find out the model elements which having specific stereotype being assigned.
Visual Paradigm’s Excel export and import allow users to import data into project. This not just for importing of model elements, but also for relationships. In this article we will show you how to create relationships between models using the Excel.
On-Demand Model ETL (Extract, Transform & Load) is a facility which allow user to query on their model elements (extract), manipulate them (transform) and further visualize them in diagram (load). The ETL table not just allow you to perform query on a single level of models, but also support nested levels such as the contained or connected elements. In this article we will show you how to configure the ETL table to perform query on 3 levels of model elements.
Visual Paradigm support visualize your data into various charts. This feature gives you valuable insights to your data. The data can be visualized by entering with the build-in spreadsheet tool, upload of Excel file, or directly link from Google Sheets. In this article we will show you how to feed in data to your chart by link to Google Sheets.
Layout of diagram is a resource intensive action. By default Visual Paradigm set the limit to handle maximum 300 connectors in single diagram when perform layout. If your diagram got more than 300 connectors then the following message will be shown when you try to perform layout.
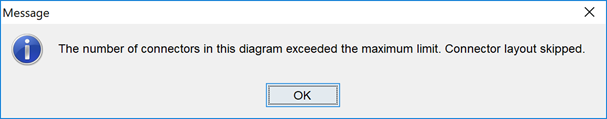
Layout diagram hitting maximum number of connector limit
You can clone a source diagram into your target diagram, so that you can make modify the diagram without affecting the source diagram. This article will demonstrate how to clone a diagram using VP-UML and modify the diagram afterward.